Overview
This report outlines a series of tests to understand the end-to-end latency of an A.I. vision pipeline using the Canopy Vision application. The goal of these tests is to understand the true delay between when an image is presented to a camera sensor and when the output of a deep neural network is displayed. The following outlines differences in model architectures, compute hardware, networking architectures, camera framerates, and more. Many factors will affect the overall end-to-end latency of a vision pipeline — these test results are meant to better understand what a reasonable expectation can be and to help guide in initial project planning for production deployments.
Test Setup
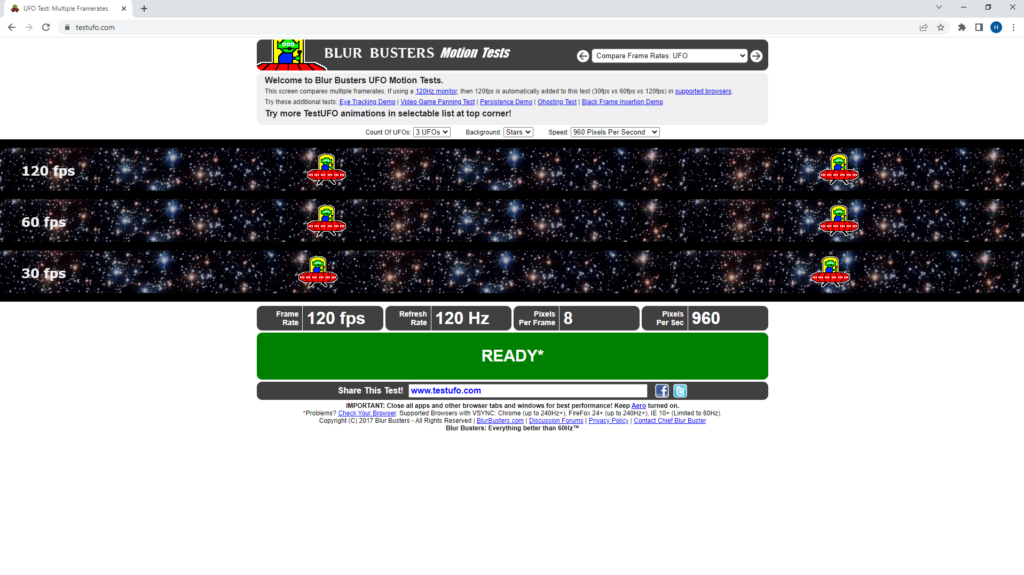
To truly test end-to-end latency, we must know the exact time an image is displayed as well as the exact time the inference output is displayed. To do this, we set up computer with an LED monitor. The LED monitor should ideally have as high of a refresh rate as possible. Most monitors are running at 60 Hz. In our test setup, we used the Samsung Odyssey monitor which supports up to a 240 Hz refresh rate. Due to other hardware limitations, we were only able to achieve an actual refresh rate of 120 Hz.
The computer connected to this LED monitor will need to run 3 application windows:
- Time Looping script
- Continuously looping the current time (with milliseconds)
- time_loop.py
- SSH Terminal Window to the computer resource
- When a button is pressed on the keyboard, an image of a woman wearing a hardhat will appear on the monitor
- display_image.py
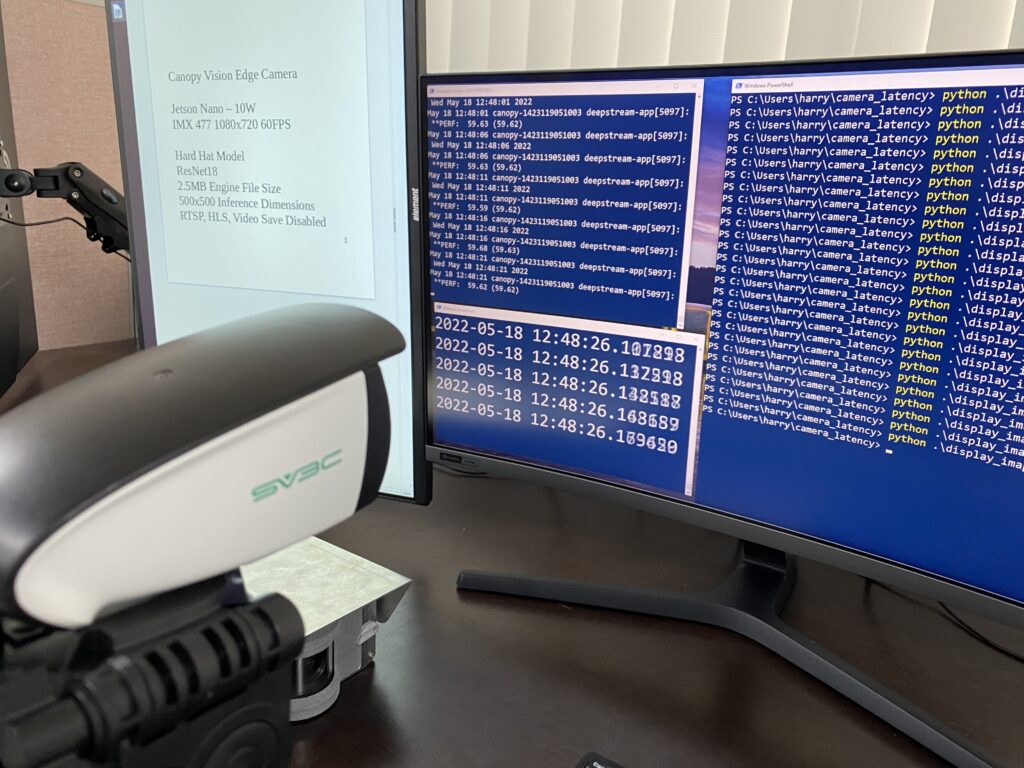
A camera will then be positioned to observe this LED monitor, making sure it can clearly see the image displayed by the display script.
On a separate window it may be helpful to display a live RTSP stream for camera positioning. Additionally, a window showing the details of each specific test will help with keeping track of each different test configuration.
Finally, from a separate camera, the test will be recorded. For this test, we used an iPhone with 240FPS slow-motion video recording.
An image of the test setup is shown below. You can see the three application windows on the right.
When the setup is ready to test:
- Begin recording on the iPhone in slo-mo
- Enter the button on the keyboard to display the image
- Wait for the output to appear on the SSH window
- Stop the iPhone recording
Analysis of end-to-end latency can be achieved by calculating the time difference between the first frame where the image appears and the first frame where the inference output appears.
Test Results
The following top-level results are shown below. Each row indicates a separate test. Three individual measurements were taken for each test. Specific details on each test setup are provided below. The specific slow-mo video files are available upon request.
| Test Setup Description | 1 | 2 | 3 | Average | FPS |
|---|---|---|---|---|---|
| Canopy Vision Edge Camera, Jetson Nano, 5W, PeopleNet (14.0MB FP16), 500×500, 60FPS camera sensor | 1150 ms | 1160 ms | 1160 ms | 1157 ms | 17.3 |
| Canopy Vision Edge Camera, Jetson Nano, 10W, PeopleNet (14.0MB FP16), 500×500, 60FPS camera sensor | 890 ms | 900 ms | 930 ms | 907 ms | 24.1 |
| Canopy Vision Edge Camera, Jetson Nano, 10W, Custom Hard Hat Model (2.5MB FP16), 500×500, 60FPS camera sensor | 350 ms | 340 ms | 340 ms | 343 ms | 60 + |
| General IP Network Camera (SV3C), 1920×1080, RTSP w/H.264, 25FPS on LAN to Jetson Nano, 10W, Custom Hard Hat Model (2.5MB FP16), 500×500, 60FPS camera sensor | 536 ms | 409 ms | 533 ms | 493 ms | 25 + |
| Canopy IMX477 RTSP w/H.264, 60FPS located in Tampa on 500/500mbps internet to Google Cloud VM instance with A100 GPU located in us-east1, Docker Container, Custom Hard Hat Model (856kb FP16), 500×500 | 204 ms | 342 ms | 331 ms | 292 ms | 60 + |
| General IP Network Camera (SV3C), 1920×1080, RTSP w/H.264, 25FPS located in Tampa on 500/500mbps internet to Google Cloud VM instance with A100 GPU located in us-east1, Docker Container, Custom Hard Hat Model (856kb FP16), 500×500 | 255 ms | 236 ms | 250 ms | 247 ms | 25 + |
| General IP Network Camera (SV3C), 1920×1080, RTSP w/H.264, 25FPS located in Tampa on 500/500mbps internet to Google Cloud VM instance with A100 GPU located in us-east1, Docker Container, Custom Hard Hat Model (856kb FP16), 500×500, 10 containers running concurrently | 285 ms | 251 ms | 315 ms | 284 ms | 25 + |
Canopy Vision Edge Camera, Jetson Nano, 5W, PeopleNet (14.0MB FP16), 500×500, 60FPS camera sensor
This test utilizes the Canopy Vision Integrated Edge Compute Camera, where a Sony IMX477 sensor is connected directly to a Jetson Nano compute module. For this test, the module was run in reduced power mode (5W). A standard off-the-shelf PeopleNet model was deployed to the device with FP16 precision. The inference engine file was 14.0MB. This model was pruned by NVIDIA to an unknown extent. The camera sensor was set to capture frames at 60FPS at a resolution of 1920×1080. The video was downsized to 500×500 resolution just prior to model inference. This setup had an average latency of 1157ms. Although the camera framerate was 60FPS, the actual framerate was only 17.3 FPS with the model inference being the bottleneck.
Canopy Vision Edge Camera, Jetson Nano, 10W, PeopleNet (14.0MB FP16), 500×500, 60FPS camera sensor
The difference between this setup and the previous one was increasing the power mode of the Jetson Nano module from 5W to 10W. The overall framerate increased by 40% while the overall latency decreased by 22%.
Canopy Vision Edge Camera, Jetson Nano, 10W, Custom Hard Hat Model (2.5MB FP16), 500×500, 60FPS camera sensor
The difference between this setup and the previous one was the model deployed. In this configuration, the PeopleNet model was replaced with a Custom Hard Hat model trained by Monomer Software for demonstration purposes. This model was trained with a ResNet18 model architecture and was pruned heavily to reduce the model size. The inference engine file is only 2.5MB compared to the 14.0MB PeopleNet model. The overall latency was 343 ms. This model performs at the full 60FPS of the camera sensor and is thereby not bottlenecking the vision pipeline. With different camera sensor settings, a higher overall FPS may be attainable which would likely lead to a lower overall latency.
General IP Network Camera (SV3C), 1920×1080, RTSP w/H.264, 25FPS on LAN to Jetson Nano, 10W, Custom Hard Hat Model (2.5MB FP16), 500×500, 60FPS camera sensor
The difference between this setup and the previous one was the replacement of the integrated IMX477 camera sensor with a standard consumer-grade off-the-shelf IP Network Security Camera. This camera is a typical security camera, often purchased for consumer or light commercial use, with a price-point around $60. The camera outputs a multicast RTSP stream with a resolution of 1920×1080 at 25FPS with H.264 compression. The camera was placed on the same LAN as a Canopy Edge Jetson Nano device. The Canopy Edge device was ingesting the RTSP stream of the IP camera and running the Hard Hat model. The average latency with this setup was 493ms with the overall framerate limited by the IP camera. Just like in the previous example, if a camera with a higher framerate was utilized, the overall latency would likely be lower.
Canopy IMX477 RTSP w/H.264, 60FPS located in Tampa on 500/500mbps internet to Google Cloud VM instance with A100 GPU located in us-east1, Docker Container, Custom Hard Hat Model (856kb FP16), 500×500
With this configuration, the computing was changed from being performed on a Canopy Edge Jetson Nano device to a datacenter GPU. The compute hardware was an NVIDIA A100 GPU running on a Google Cloud Compute Engine instance. The Compute Engine was located in the US-East region (South Carolina). The camera stream was a Canopy IMX477 camera streaming 60FPS from a Jetson Nano using the onboard video encoder. No inference was being performed on the Jetson Nano device. The Jetson Nano device was connected to the Monomer Software office LANE in Tampa, FL via Ethernet to a 500/500mbps connection to the external internet. For this pipeline, the image captured by the camera in the Monomer Software office was transmitted via RTSP to the Google Cloud datacenter computer, analyzed with the Canopy Vision application running as a Docker container with the A100, and the inference output was returned back to the Monomer Software office all with a total round-trip latency of only 292 ms. Multiple options are available the bring this latency even lower.
General IP Network Camera (SV3C), 1920×1080, RTSP w/H.264, 25FPS located in Tampa on 500/500mbps internet to Google Cloud VM instance with A100 GPU located in us-east1, Docker Container, Custom Hard Hat Model (856kb FP16), 500×500
The difference between this setup and the previous one was the replacement of the Canopy IMX477 camera with the same off-the-shelf RTSP camera used in other previous tests. This test configuration demonstrates the lowest overall end-to-end latency at only 247 ms. The test video with the lowest reported latency is provided below. The image was displayed at 09.462. The output was displayed at 09.698, resulting in a total end-to-end latency of 236 ms.
General IP Network Camera (SV3C), 1920×1080, RTSP w/H.264, 25FPS located in Tampa on 500/500mbps internet to Google Cloud VM instance with A100 GPU located in us-east1, Docker Container, Custom Hard Hat Model (856kb FP16), 500×500, 10 containers running concurrently
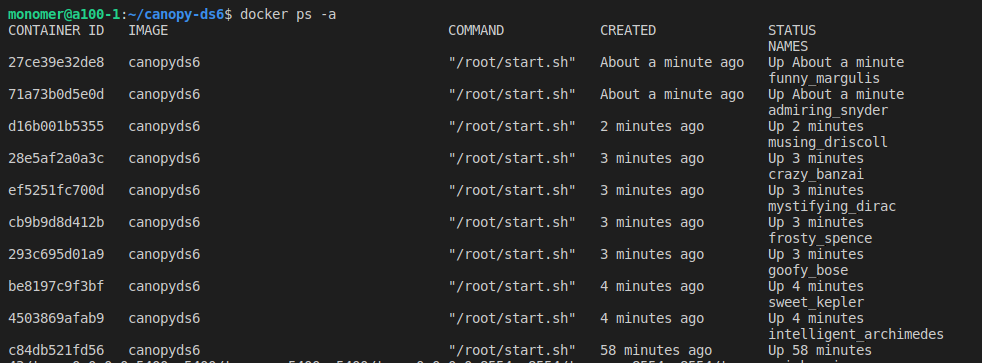
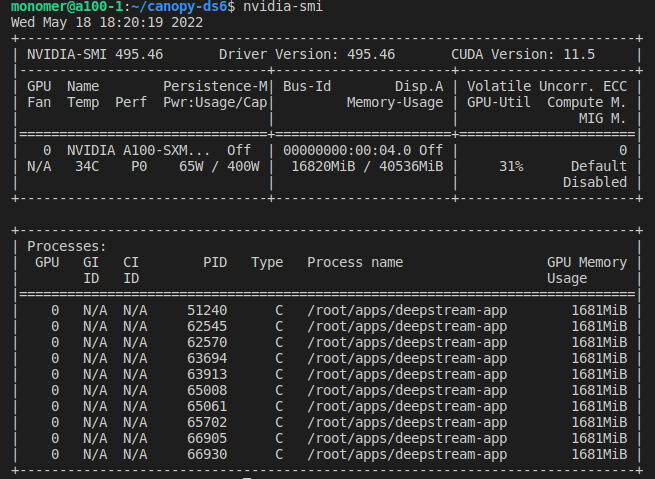
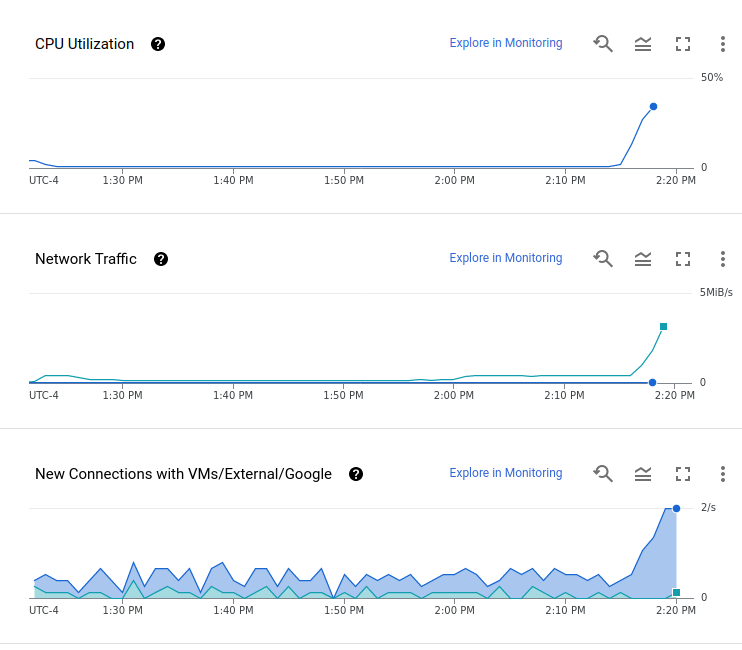
The difference between this setup and the previous one was adding additional Docker container instances on the same A100 VM. 10 Canopy Vision Docker Container instances were run in parallel reading the same RTSP camera stream from the Monomer Software office. This test was conducted to determine what impact multiple Docker container instances might have on an individual stream’s latency. The resulting latency for this configuration was 37ms longer than the latency with only 1 Docker instance. Additional performance improvements could likely be made to reduce this additional latency overhead. During this test the GPU utilization and CPU utilization were measured, with screenshots provided below. Even at 10 instances, the camera stream was still steady at 25FPS, indicating no bottlenecking by having additional streams on the same A100 GPU.
Additional Notes and Observations
Test setup limitations
During previous testing with a 60Hz monitor and a Linux computer, we had observed a latency measurement on the Canopy Edge Jetson Nano with the integrated IMX477 camera that was below 160ms. During the test results presented in this report, a 120Hz monitor was used with a Windows laptop. No configuration was able to achieve <235ms latency. This challenges some of the assumptions about the testing. We intend to find the best combination of LED monitors and computers to provide the most correct measurement of latency. Knowing this, the reported latency numbers above are likely conservative estimates. Delays in monitor time, application window display time, and other network factors are likely to increase the latency as measured in these tests.
Off-The-Shelf IP Camera vs Canopy IMX477
Surprisingly, the off-the-shelf IP camera with a 25FPS framerate showed lower latency than the IMX477 RTSP stream from the Jetson Nano, which was running at 60FPS. This is likely due to latency delays caused by the Jetson Nano, either at the hardware encoding step or the networking step onboard the Jetson Nano. Additional testing may uncover why the Jetson Nano has a larger latency for RTSP streaming.
Post-Processing considerations
These test results do not include any post-processing computation time. For most projects, additional post-processing business logic is necessary to determine if the inference output is in an alarm state or to generate other calculated metrics from the inference output. Because every project is different, the goal of this test was to determine latency prior to post-processing. This test can easily be repeated with specific post-processing logic applied.
Proposed Future Test Configurations
Based upon these tests and Monomer Software’s expertise in the field, the following differentiations should be tested:
- A100 vs T4 vs other GPU Hardware
- Cloud Compute Region and other Network Adjustments
- Multicast vs Unicast RTSP
- H.264 vs H.265 vs MJPEG RTSP compression
- RTSP vs other streaming protocols
- Jetson Nano vs Jetson TX2 NX vs Jetson Xavier NX
- Model Inference Data communicated via TCP vs UDP
- INT8 vs FP16 vs FP32